Growing up in a small village in New York five miles from Queens, 12-year-old Jack Kaye spent his days concerned with things like how to get to Shea Stadium to watch a Mets game. Though he still loves baseball, Kaye’s focus turned to science starting in high school and continued throughout his decades-long career with NASA’s Earth science.
But whether in Washington, D.C., or traveling the planet for work, thoughts of home and Long Island were never too far from mind. “When I was a kid, I didn’t think about the area’s vulnerability or how interconnected the suburbs and city were,” said Kaye, retired associate director for NASA’s Earth Science Division. “Now I do.”
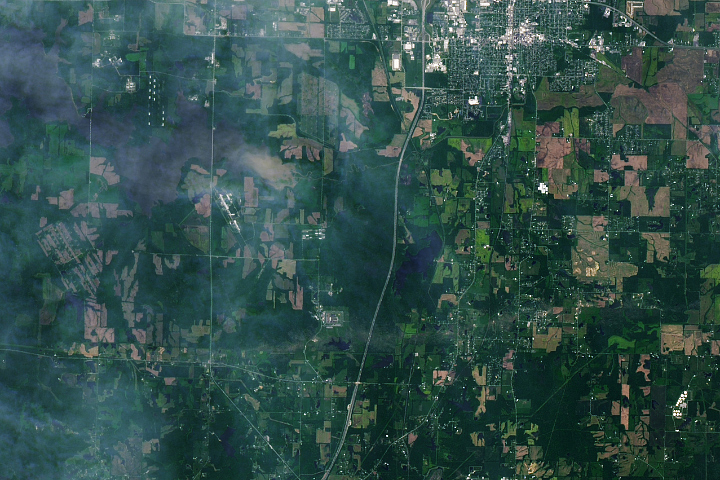
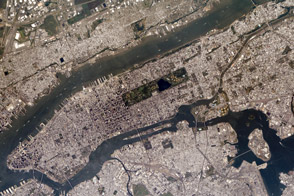
Much of the New York City metropolitan area is visible in the image above, captured by the OLI (Operational Land Imager) on Landsat 8 on August 9, 2023.
Kaye’s hometown village of Malverne is visible, as well as the schools that played a formative role in his education. After studying chemistry at Adelphi University and earning a doctorate in the subject from Caltech, Kaye went on to work with the stratospheric chemistry group at NASA’s Goddard Space Flight Center in Maryland.
In 1989, he moved to NASA Headquarters in Washington, D.C., where for around 35 years he listened to the research community and developed strategies to help researchers characterize and understand some of the most critical Earth scientific topics of the day. Topics ranged from the ozone hole and climate change to hurricanes and sea level change to water management and agriculture.

But one of the proudest undertakings of his NASA career, Kaye says, was providing the direction and support that has helped scientists build an increasingly detailed understanding of cities, suburbs, and the quality of the air that people breathe.
While 8.2 million people live in New York City’s five boroughs, the wider metropolitan area is home to more than twice that number of people, making it the largest megacity in the United States. It is also the largest source of air pollution in the eastern U.S.—with plenty of it wafting into his hometown.
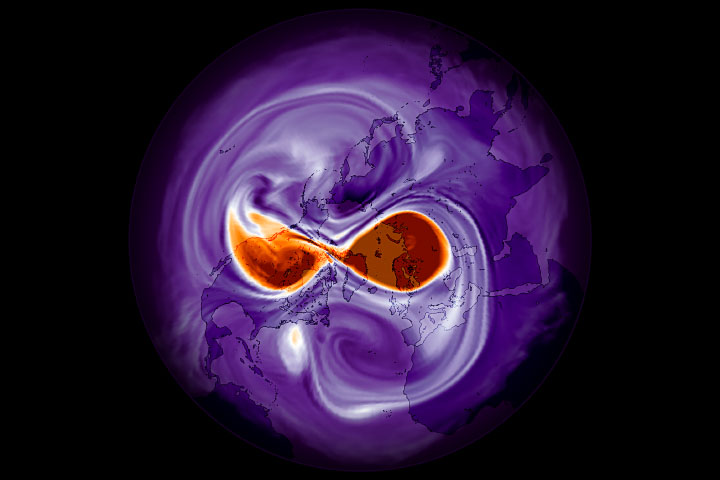
The sequence of images above shows a plume of nitrogen dioxide (NO2) emerging from New York City around noon local time on August 9, 2023. The reddish-brown gas, primarily a byproduct of fossil fuel combustion, is considered hazardous to human health. It also contributes to the formation of ground-level ozone and particulate matter, which are also health hazards.
Data for the maps are from NASA’s TEMPO (Tropospheric Emissions: Monitoring of Pollution) sensor. Launched in April 2023, the mission is NASA’s first Earth science research instrument in a geostationary orbit and measures several types of air pollution on an hourly basis. TEMPO brings improved spatial and temporal resolution to satellite-based observations of air pollution over North America, helping scientists and air quality forecasters identify pollution sources and movement.
“Every day in the Mid-Atlantic region, the largest source of NO2 we see is from New York City,” said Laura Judd, an atmospheric scientist at NASA’s Langley Research Center. She added that the size and location of the plume change from day to day and even from hour to hour—differences that stem from the relationship between the emission sources, weather, and atmospheric chemistry.
When Kaye was young, he says there were occasions of noticeably poor air quality on Long Island. Situated on flat terrain, winds can easily move pollution around the region, making it less concentrated than some cities located in bowl-shaped terrain. Still, he recalls that pollution would accumulate near incinerators or when people burned yard waste in the suburbs. “People didn’t worry about a lot of that stuff,” he said.
Now, with TEMPO and other technologies, scientists have a better picture of where the pollution originates and where it is going. On the morning of August 9, winds were out of the northwest, and NO2 built up over the city. By the start of the time series shown above, winds had shifted and carried the NO2 eastward along Long Island throughout the afternoon.
Judd said that high pollution days of interest in the region often coincide with excess NO2 extending over Long Island Sound from the city. Over the sound, efficient production of harmful pollutants like ozone can occur that are carried inland by sea breezes. The phenomenon has long been a motivating factor for getting detailed measurements of the region.
With its hour-by-hour observations, TEMPO is revealing unobserved patterns from an unprecedented perspective each day, which is providing new information that people are using to address air quality challenges, Judd said. “Collecting this type of data would not have been possible without Jack Kaye’s support.”
“Part of what NASA does is make the unfamiliar familiar,” Kaye said. But he noted that it can also work the other way. “If we look at something that has been seen before in new and different ways, especially with new observational approaches, we can recognize and begin to understand complexity that we didn’t know existed.”

Complex missions like TEMPO often include ground- and air-based components. Kaye snapped the photo above in August 2023 during the STAQS (Synergistic TEMPO Air Quality Science) airborne campaign as the Gulfstream-III flew over Long Island. During the NASA-NOAA campaign, instruments mounted on aircraft collected measurements that scientists later compared with observations from TEMPO and ground-based instruments. Such comparison allows scientists to validate the accuracy of each dataset and helps them better understand the Earth system.
“We harness some of the best science and technology and bring new observational capability to the nation and world. But we do it because there is a clear path to benefiting society with the knowledge we gain,” he said.
Though Kaye officially retired in April 2025, he plans to stay engaged with the scientific community via professional societies and lectures. He also plans to spend some time honing his writing. Should he find himself visiting his hometown, he might even attend another Mets game with his grandchildren at Citi Field, which replaced Shea Stadium in 2009.
But knowing him, don’t be surprised if you find him at a game comparing the error rates of his beloved Mets with the latest data coming down from TEMPO to settle, once and for all, whether there is a relationship between poor air quality and dropped fly balls—something that previous research has shown may be connected.
NASA Earth Observatory images by Lauren Dauphin, using Landsat data from the U.S. Geological Survey and TEMPO data from NASA Earthdata. Photograph by Jack Kaye. Story by Kathryn Hansen.